1. Prometheus简介
Prometheus是最初在SoundCloud上构建的开源系统监视和警报工具包。自2012年成立以来,许多公司和组织都采用了Prometheus,该项目拥有非常活跃的开发人员和用户社区。现在,它是一个独立的开源项目,并且独立于任何公司进行维护。为了强调这一点并阐明项目的治理结构,Prometheus于2016年加入了Cloud Native Computing Foundation,这是继Kubernetes之后的第二个托管项目。
1.1. Prometheus特征
普罗米修斯的主要特点是:
- 一个多维数据模型,其中包含通过度量标准名称和键/值对标识的时间序列数据;
- 具备PromQL查询语言,是一种灵活的可利用维度的查询语言;
- 不依赖分布式存储;单服务器节点自治;
- 通过HTTP上的拉取模型数据进行时间序列收集;
- 通过中间网关支持推送时间序列;
- 通过服务发现或静态配置发现目标;
- 多种图形和仪表板支持模式。
1.2. Prometheus组件构成
普罗米修斯的生态系统是由各种不同的组件构成,其中组件都是可选的:
- Prometheus Server主服务器,它会抓取并存储时间序列数据;
- Client Library客户端库提供了可检索的应用代码;
- Push gateway推送网关支持短生命周期的Job工作任务;
- 特定的Exporters提供了多种HAProxy, StatsD,Graphite等定制服务;
- Alertmanager提供了告警的控制;
- 并兼容多种辅助工具。
1.3. Prometheus体系架构
下图说明了Prometheus的体系结构及其某些生态系统组件:
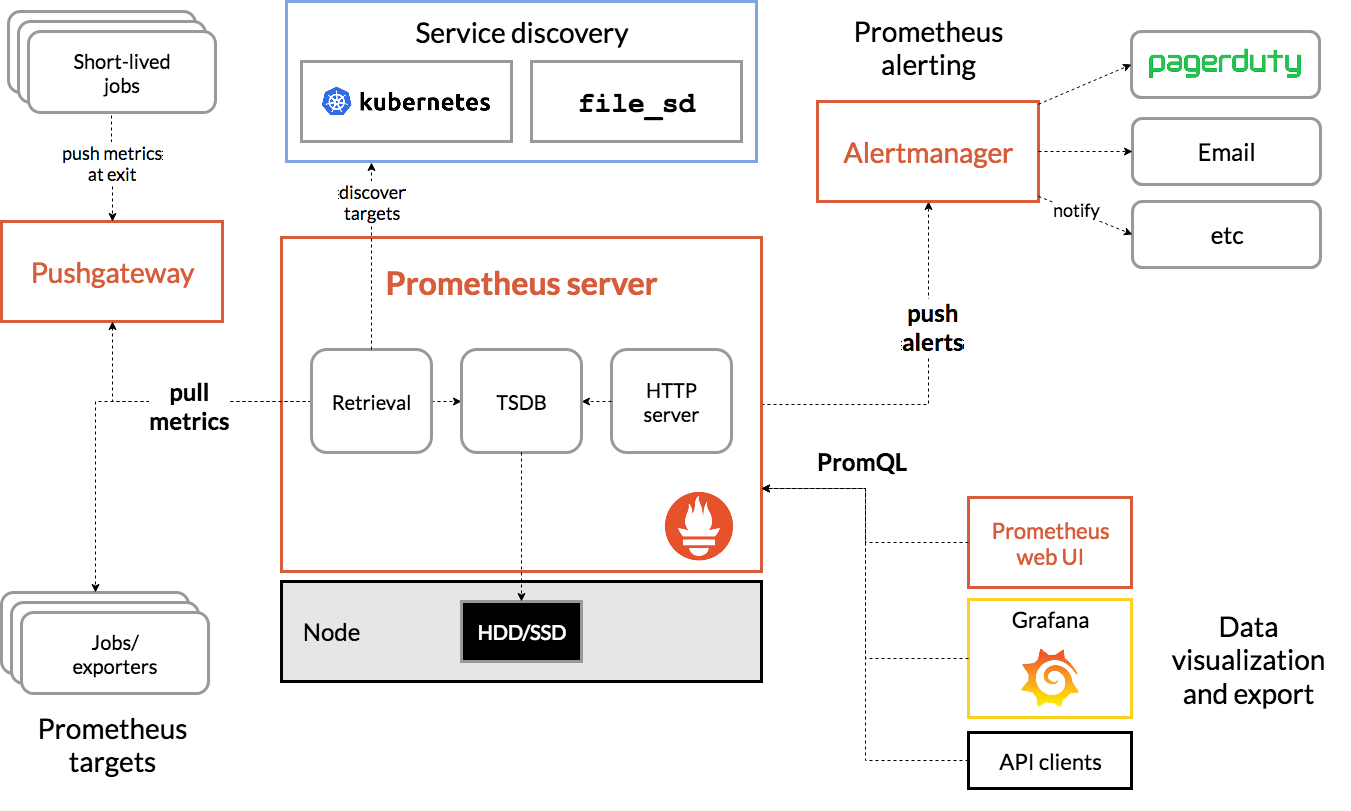
Prometheus直接或通过中间推送网关从已检测作业中删除指标,以用于短期作业。它在本地存储所有报废的样本,并对这些数据运行规则,以汇总和记录现有数据中的新时间序列,或生成警报。 Grafana或其他API使用者可用于可视化收集的数据。
2. 安装配置Prometheus
下面介绍如何安装Prometheus,并且利用两个exporter去监控Linux server和Mysql数据库。这里需要用到node_exporter和mysqld_exporter两个收集器。
- 首先我们下载Prometheus Server,并使用prometheus.yml配置文件启动服务:Prometheus本身提供web界面。当Prometheus Server启动起来后,可通过浏览器访问地址http://localhost:9090/graph 来进入Prometheus web界面。
1
2
3
4
$ wget https://github.com/prometheus/prometheus/releases/download/v2.15.2/prometheus-2.15.2.linux-amd64.tar.gz
$ tar zxvf prometheus-2.15.2.linux-amd64.tar.gz
$ cd prometheus-2.15.2.linux-amd64
$ ./prometheus --config.file=prometheus.yml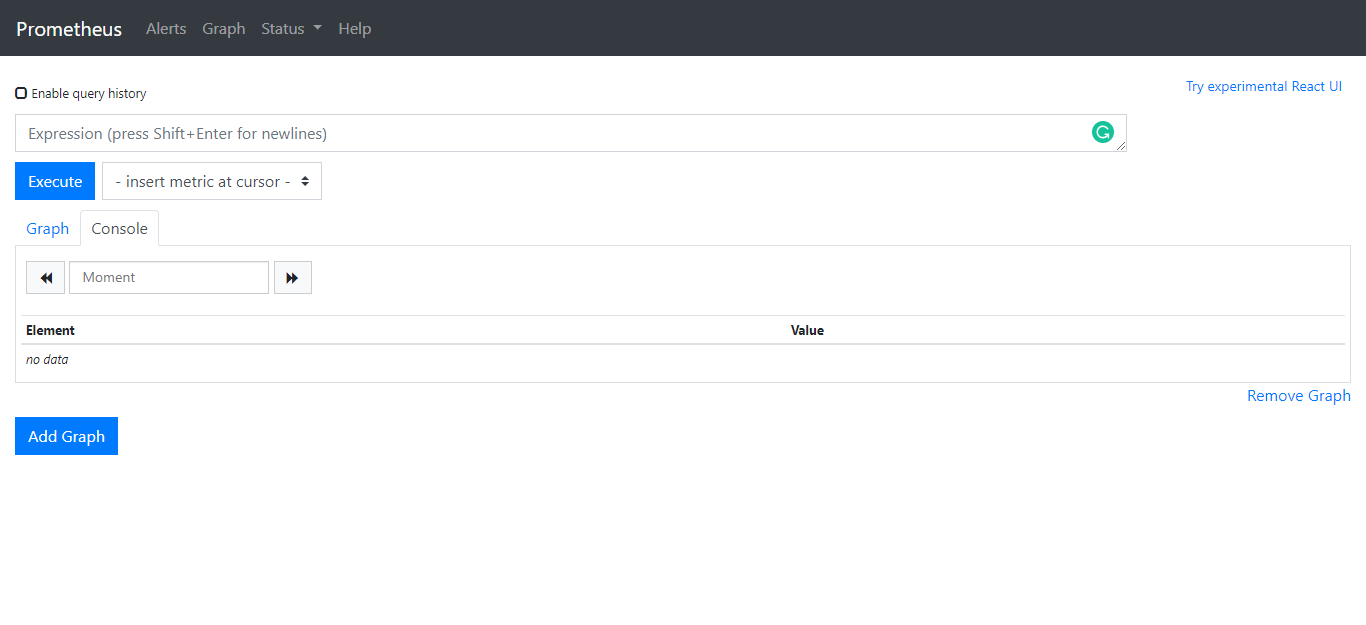
- 接着下载并安装node_exporter收集器来收集Linux Server性能数据:
1
2
3
4
$ wget https://github.com/prometheus/node_exporter/releases/download/v0.18.1/node_exporter-0.18.1.linux-amd64.tar.gz
$ tar zxvf node_exporter-0.18.1.linux-amd64.tar.gz
$ cd node_exporter-0.18.1.linux-amd64
$ ./node_exporter - 最后下载并安装mysqld_exporter收集器来收集Mysql性能数据,在安装收集器之前需要先在数据库新建用户以提供mysqld_exporter收集器所需的Mysql权限:安装mysqld_exporter收集器,并在mysqld_exporter-0.12.1.linux-amd64解压缩后的目录下新增一个名为.my.cnf文件:
1
2
GRANT REPLICATION CLIENT,PROCESS ON *.* TO 'mysql_monitor'@'localhost' identified by 'mysql_monitor';
GRANT SELECT ON *.* TO 'mysql_monitor'@'localhost';1
2
3
4
5
6
7
8
9
10$ wget https://github.com/prometheus/mysqld_exporter/releases/download/v0.12.1/mysqld_exporter-0.12.1.linux-amd64.tar.gz
$ tar zxvf mysqld_exporter-0.12.1.linux-amd64.tar.gz
$ cd mysqld_exporter-0.12.1.linux-amd64
$ cat /usr/local/mysqld_exporter-0.10.0.linux-amd64/.my.cnf
[client]
user=mysql_monitor
password=mysql_monitor
./mysqld_exporter --config.my-cnf=".my.cnf" - 最后为了能在Prometheus Server服务器端能够接收node_exporter和mysqld_exporter采集到的数据,需要在prometheus.yml中新增如下配置:重启Prometheus Server应用后,在Prometheus Web界面中的Status->Targets页面,可以看到Mysql和L两个Target的状态已经变成UP了:
1
2
3
4
5
6
7
8
9
10
11
12
13
14
15
16
17scrape_configs:
# The job name is added as a label `job=<job_name>` to any timeseries scraped from this config.
- job_name: 'prometheus'
# metrics_path defaults to '/metrics'
# scheme defaults to 'http'.
static_configs:
- targets: ['localhost:9090']
- job_name: 'server'
static_configs:
- targets: ['localhost:9100']
- job_name: 'mysql'
static_configs:
- targets: ['localhost:9104']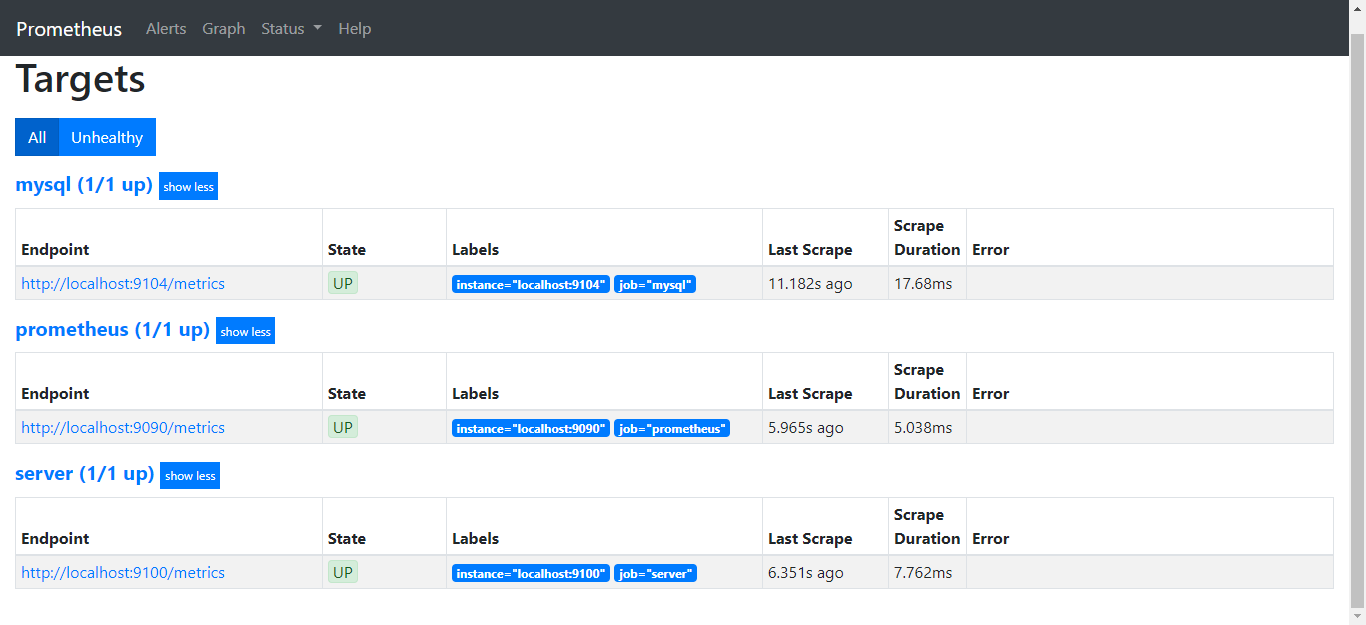 更多参考:Prometheus中文文档
3. Grafana安装配置
Grafana是一款开源的应用分析和监控解决方案。由于Prometheus Web的界面过于简单,为了能够更绚丽的展示Prometheus监控的应用数据,这里选用Grafana实现监控数据的动态可视化组合Dashboard。
- 首先先下载并运行Grafana:Grafana启动后,我们可通过http://monitor_host:3000 访问Grafana网页界面(默认登陆帐号/密码为admin/admin):
1
2
3
4
$ wget https://dl.grafana.com/oss/release/grafana-6.5.2.linux-amd64.tar.gz
$ tar -zxvf grafana-6.5.2.linux-amd64.tar.gz
$ cd grafana-6.5.2.linux-amd64
$ ./bin/grafana-server web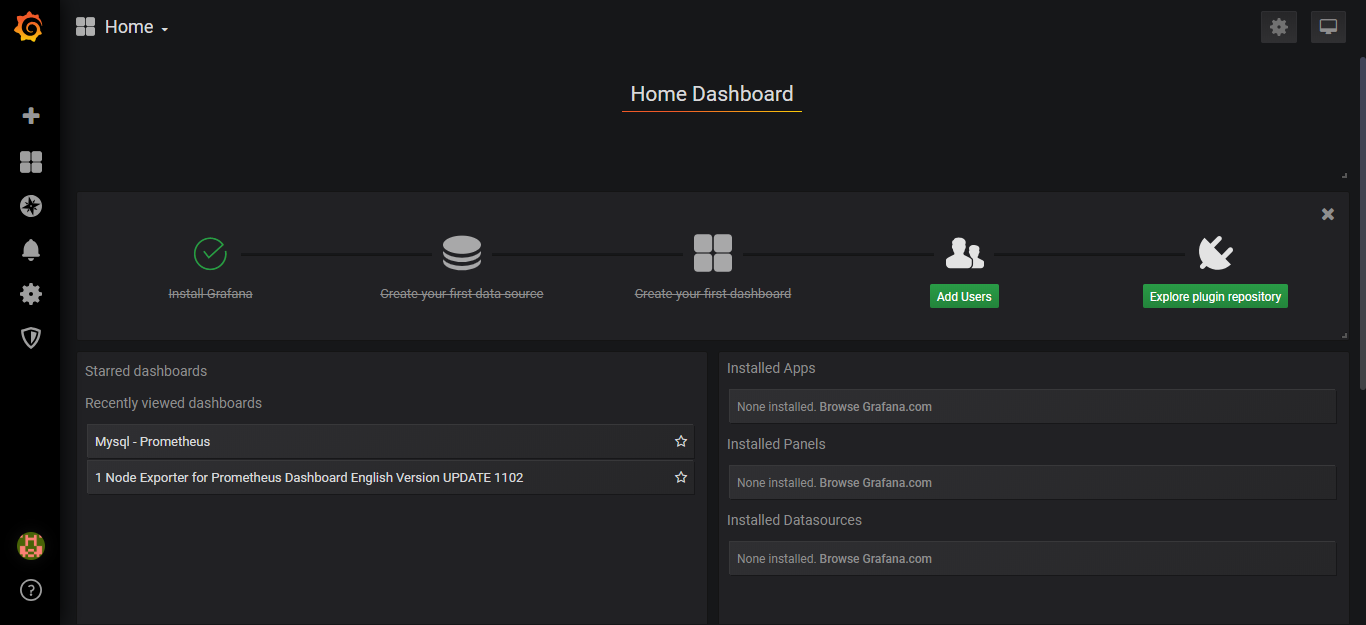
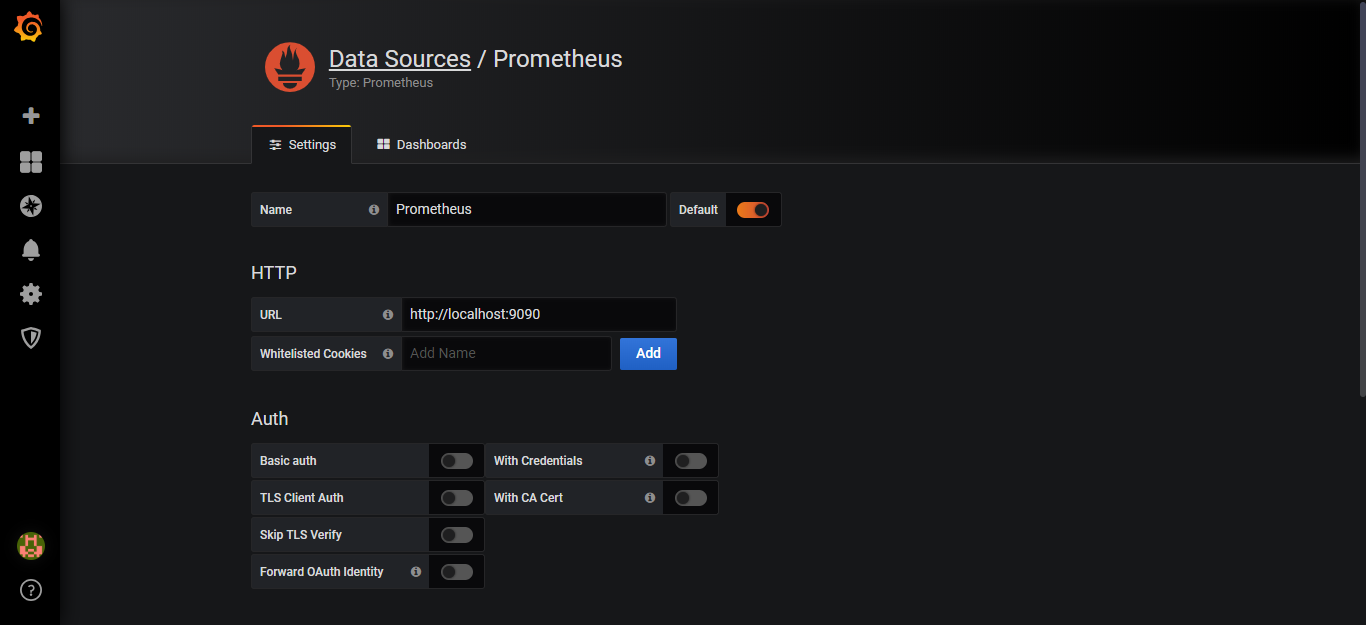
- 接着,新建一个Data Source以从Prometheus接收数据:
- 然后新建两个Dashboard面板来动态展示Linux和Mysql的监控情况,这里我们可以从Grafana Lab上下载相关应用的Dashboard面板现成样式。
Server Dashboard模板: Mysql Dashboard模板:
 这里我们只要复制对应的Dashboard的编号,比如上图中Server Dashboard编号是11074和Mysql Dashboard编号是6239。
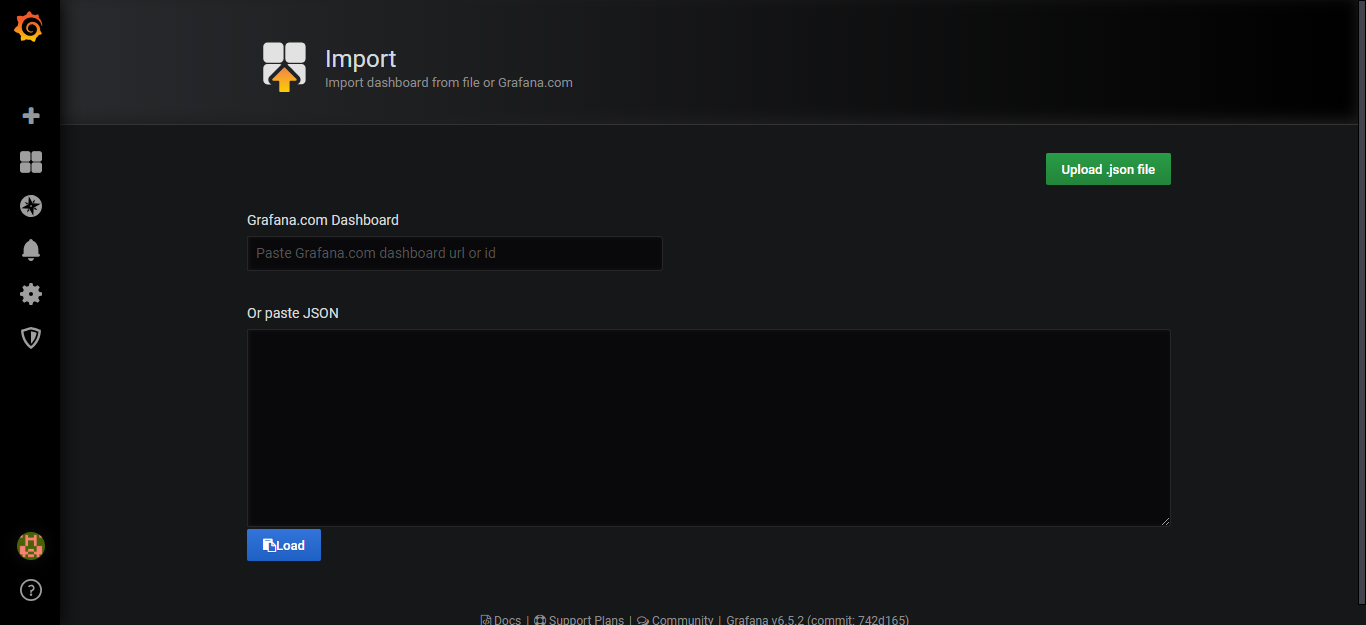
 - 接下来,在Grafana的Import界面粘贴对应的编号,然后生成Unique identifier (uid)和配置Prometheus Data Source:
- 最后,生成的Dashboard界面如下:
Server Dashboard界面: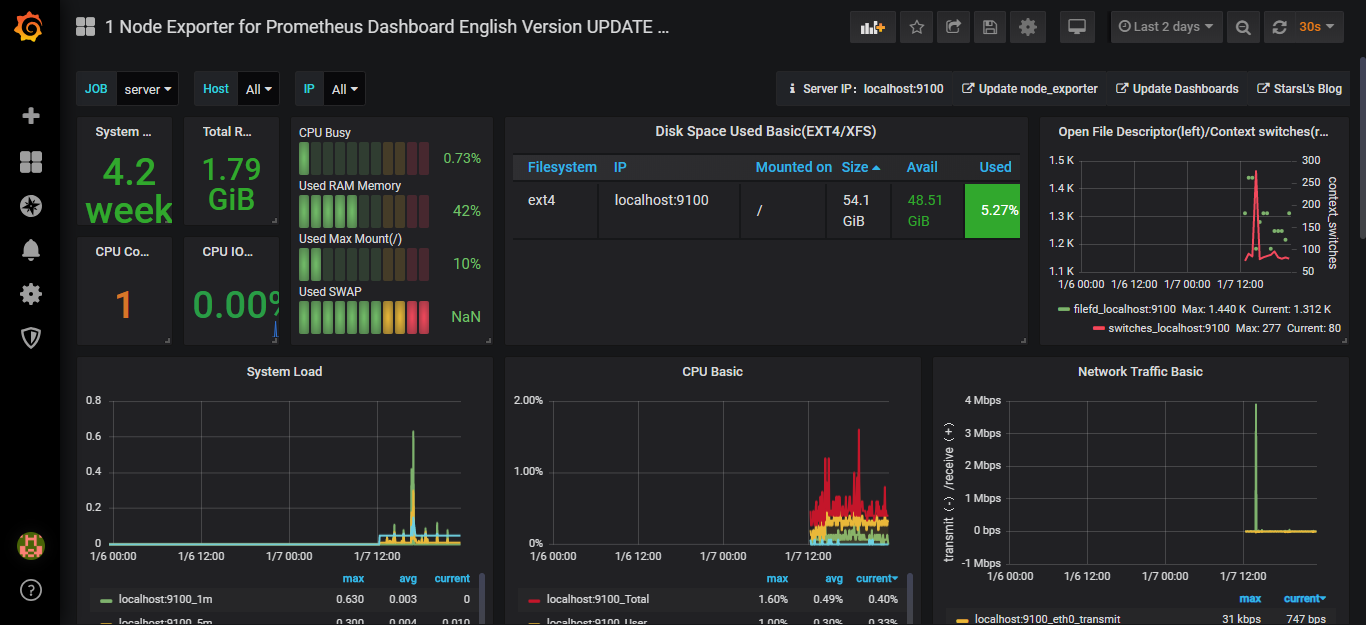 Mysql Dashboard界面:
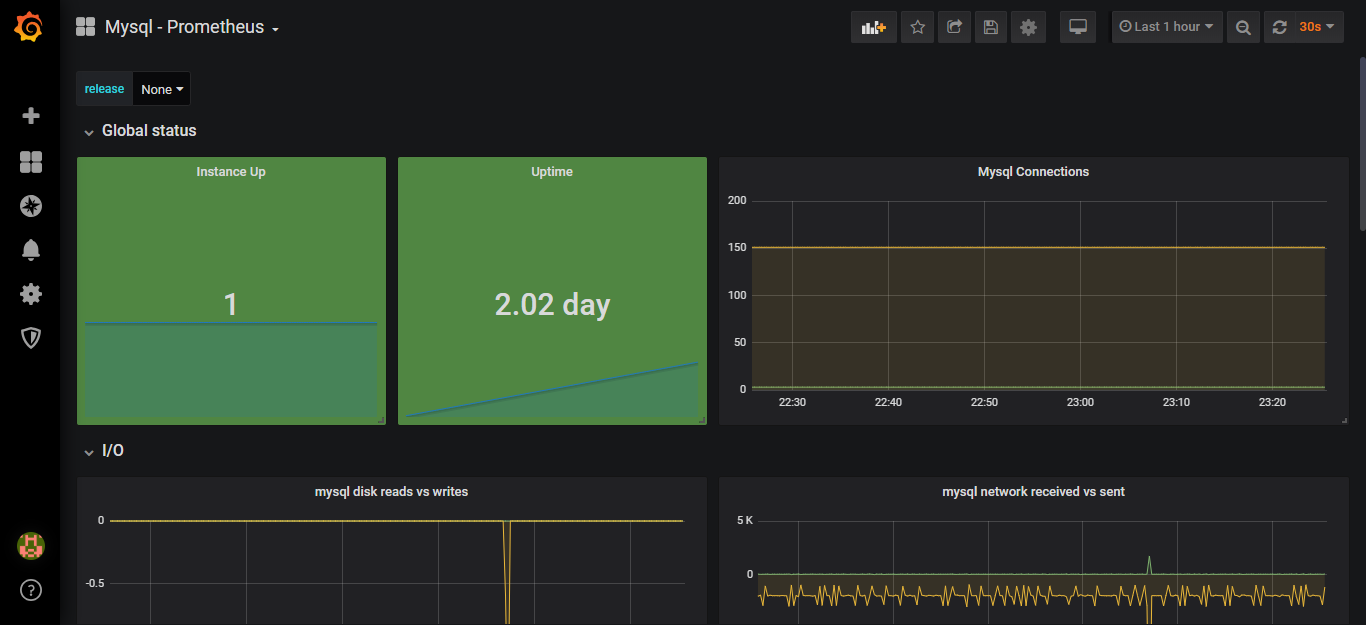
4. 结语
至此,整个Prometheus+Grafana监控平台搭建与配置完成。如有疑问欢迎留言!

